Web, tools and automation
- Web design
- Programming
- Data analysis
Websites to present a business and software tools to streamline repetitive tasks. Two projects, drawn from my personal work and doctoral research, illustrate this approach.
Website design
The portfolio you’re browsing is an example of web design for presenting services. It brings together my background, my work and ways to contact me within a consistent visual identity.
Structuring the content
Organizing services, background and projects so visitors can easily explore what you offer.
Creating a visual identity
Combining a colour palette, typography and photographs that reflect your mission and give the site a consistent look.
Showcasing the work
Presenting each project on a dedicated page, with explanations, galleries and images that can be enlarged.
Adapting to different screens
Adapting the layout, images and navigation so the content works on both computers and phones.
Automated scientific data analysis
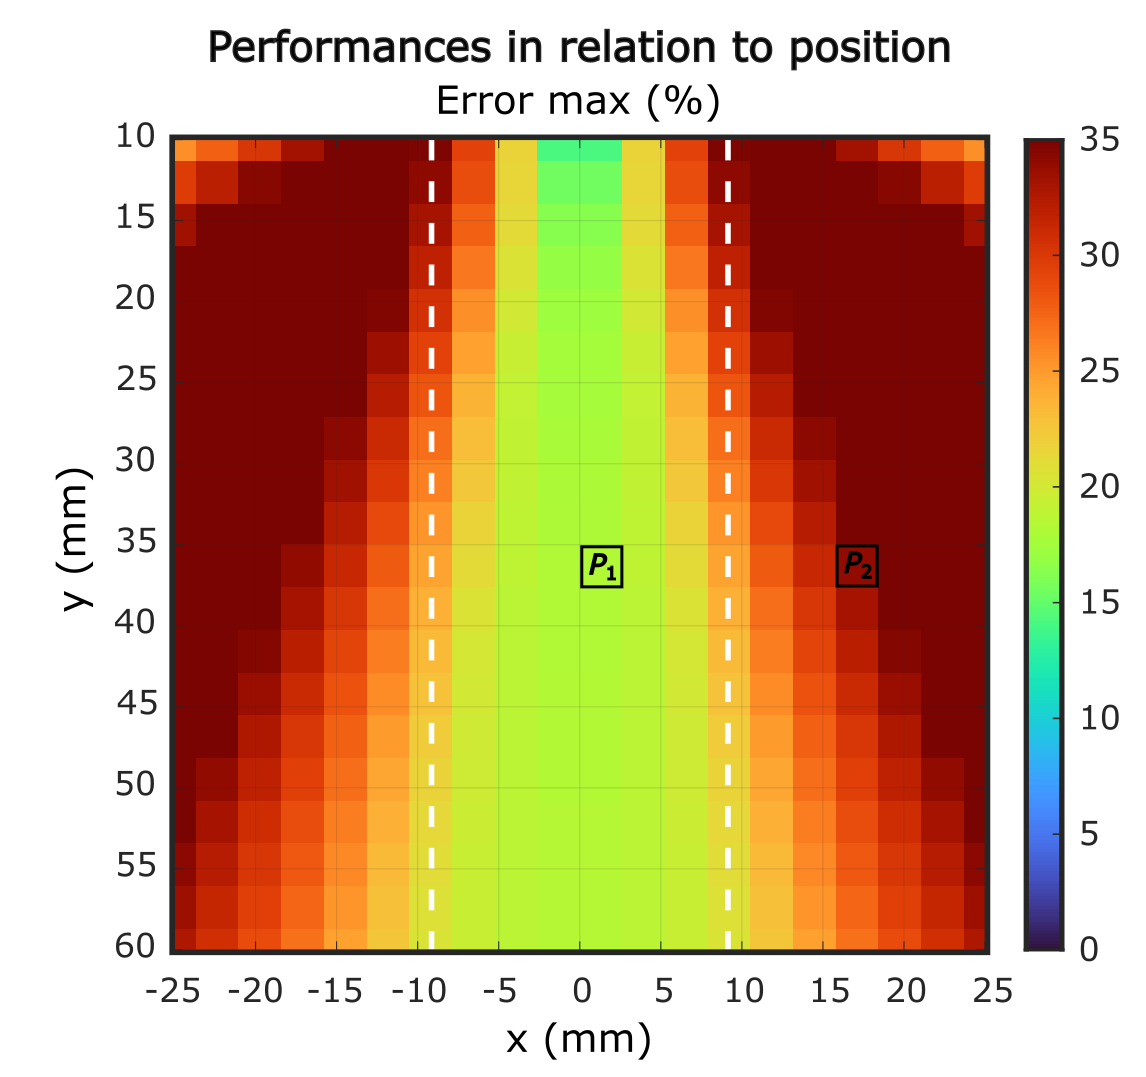
As part of my PhD, I develop programs to process ultrasound acquisitions, calculate statistical measures — including means and standard deviations — and automatically generate graphs.
Many files, one overview
In the map below, each coloured cell represents a result calculated from the data in an acquisition file. The figure combines the processing of dozens of files to compare performance by position. Here, the colour indicates the maximum error as a percentage.
The automated steps
- Read the filesLoad the acquisition data to be analysed.
- Process the dataApply the algorithms to each acquisition.
- Calculate the metricsExtract the results and statistics needed for the analysis.
- Generate the graphsBring the results together in comparable figures.
Visualizing ultrasound data
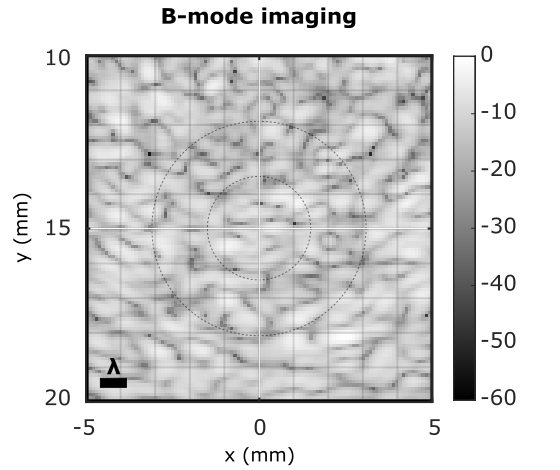
This ultrasound image is another visualization example from my PhD. It illustrates how ultrasound data can be represented as a greyscale image.
These tools apply the same processing sequence to multiple files and make it easier to compare the results.
Need a website or a simpler workflow?
Would you like to present your business, process files or generate reports? Let’s talk about your needs and the steps we could simplify together.
Discuss your project